Imagine a coiled spring compressed to its limit after years of steady pressure. The force builds silently, invisibly, until a sudden release unleashes explosive upward momentum. Gold, in its latest October 2025 correction—a sharp 10% plunge over six trading sessions—behaves no differently. As Peter L Bernstein presciently wrote in The Power of Gold: The History of an Obsession (2000), “Gold is the ultimate survivor. It has outlasted every currency, every empire, every financial panic. When everything else fails, gold endures.” This enduring quality is not mere poetry; it is empirical reality, etched across decades of market history. The recent dip, far from signaling a peak, is a classic consolidation within a multi-year structural uptrend—one that investors dismiss at their peril. Investment world has ran 60:40 portfolio of Equity : Bond for long, now time is suggesting 60:20:20 portfolio, making entry of gold as a key allocation.
Historical Precedent: Corrections as Entry Points, Not Exits
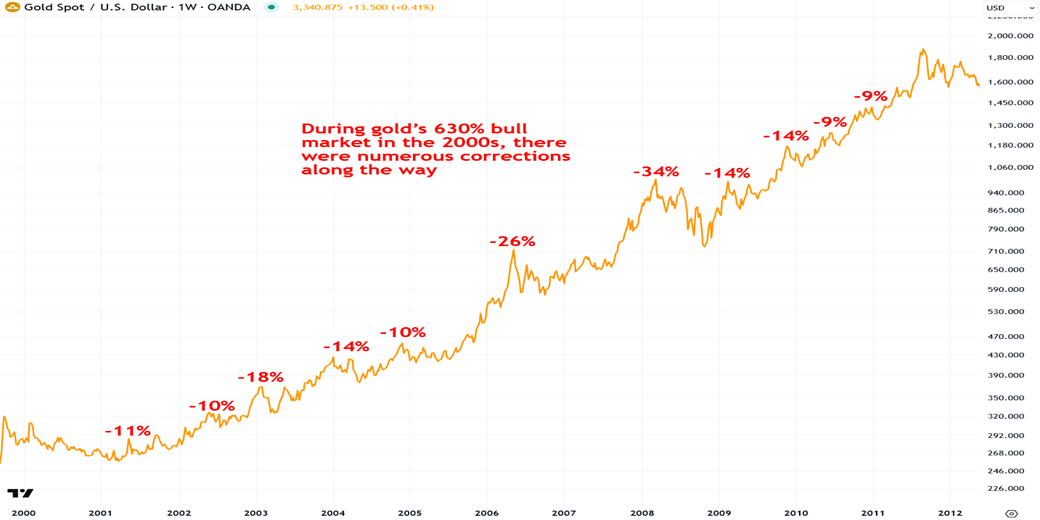
Over the past five decades, gold has endured 17 instances of declining more than 10% within six days, only to stage robust recoveries. The median performance tells a compelling story of resilience: Post-correction, gold has delivered positive returns in 81% of cases within one day, 75% within three days, 94% within one week, 81% within one month, and 88% within two months. The October 20, 2025, event already mirrors this pattern: +1.90% in one day and +3.61% in three days. Investors capitulating amid recency bias ignore this statistical inevitability—short-term pain yielding long-term gain.
Structural Tailwinds: Beyond Cyclical Noise
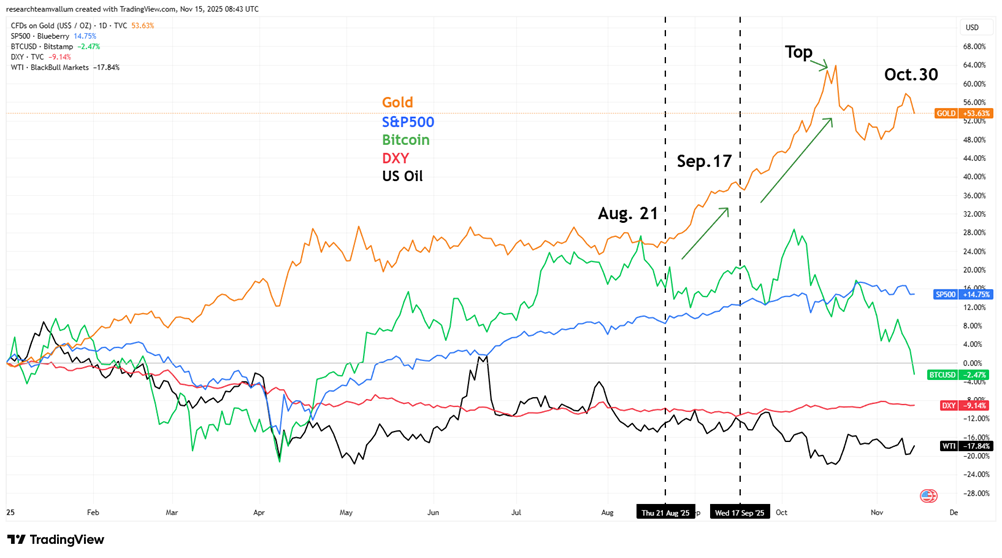
Year-to-date (YTD) through November 15, 2025, gold leads with outsized gains while risk assets falter:
- Gold: +51.31%
- Bitcoin: +51.47%
- S&P 500: +7.3%
- DXY (US Dollar Index): -1.78%
- US Oil (WTI): -17.84%
Gold’s breakout began in earnest around August 21, accelerating post-September 17 to a October 30 peak—decoupling from equities, oil, and even Bitcoin during stress periods. This is no tactical fluctuation; it reflects a regime shift.
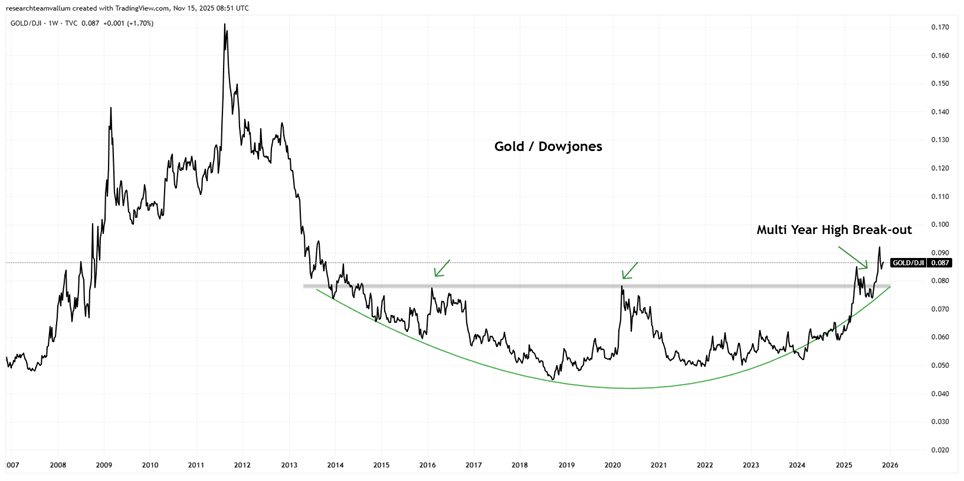
The Gold/Dow Jones ratio confirms a multi-decade breakout above 2015 lows, forming a rounded bottom and signalling a structural rotation favouring gold over equities. Meanwhile, the DXY has entered a confirmed multi-year bear phase, aligning with 7–10-year historical cycles. The “Trump acceleration” spike marked a cyclical top, forcing policy choices to avert broader dislocation. We are in a structural rotation, not a mere cyclical uptick.
The Dollar’s Secular Decline and Gold’s Anchor Role
The US Dollar Index (DXY) chart reveals a 10-year cycle culminating in the recent peak, now descending into a new bear phase. Historical precedents—from Weimar hyperinflation to the 1970s stagflation—show gold thriving as fiat erodes. In the 1920s German crisis, gold appreciated thousands-fold while the mark vanished. Today’s debasement is subtler but no less real: deficits swell, currencies soften, and gold reemerges as the ultimate hedge.
Conclusion: Embrace the Spring, Ignore the Snap
The October 2025 correction triggered predictable capitulation—emails flooding in: “Has gold peaked?” “Time to sell?” Such a myopic focus on noise blinds investors to the structural tailwinds propelling this secular bull. History substantiates the bounce: median +6.91% in two months post-dip, with 88% positivity. Volatility consolidates; it does not invalidate. As author of The Power of Gold remind us, Gold endures when empires falter. Position for the long-term uptrend—the spring is uncoiling, and the launchpad is set.
Manish Bhandari, CIIA, founder of Vallum Capital Advisors, a Portfolio Management firm managing equity investments for Family Offices, NRIs and HNIs, serves as a Board Member of the Association of Portfolio Managers in India. Based in Mumbai, he can be reached at manish.bhandari@vallum.in.
 Principles